Service graphs
|
|
|
|
Graph Information
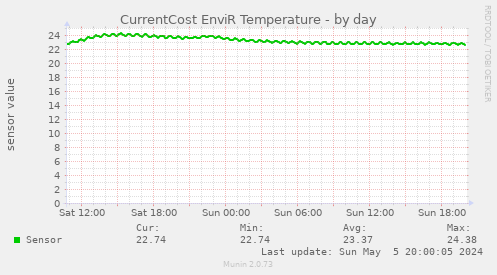
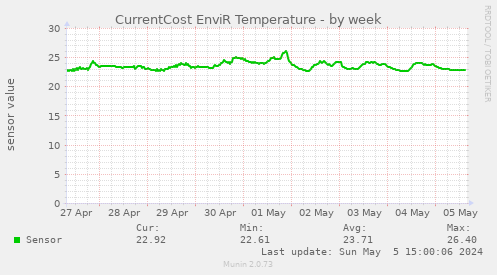
This graph shows the values of sensors connected to a CurrentCost EnviR device.
| Field | Internal name | Type | Warn | Crit | Info |
|---|---|---|---|---|---|
| Sensor | sensor | gauge | Degrees. |
|
|
|
|
|
|
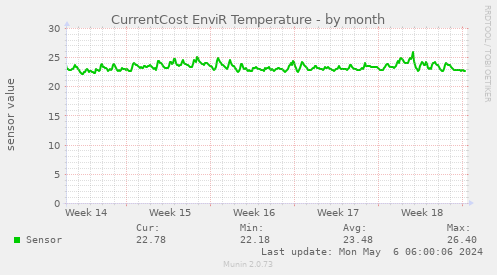
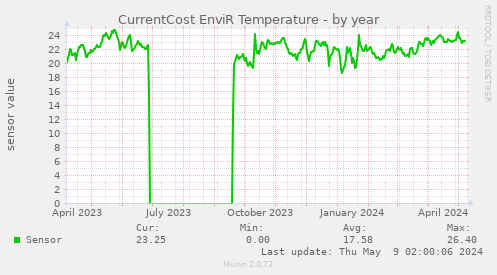
This graph shows the values of sensors connected to a CurrentCost EnviR device.
| Field | Internal name | Type | Warn | Crit | Info |
|---|---|---|---|---|---|
| Sensor | sensor | gauge | Degrees. |