Service graphs

|

|

|

|
Graph Information
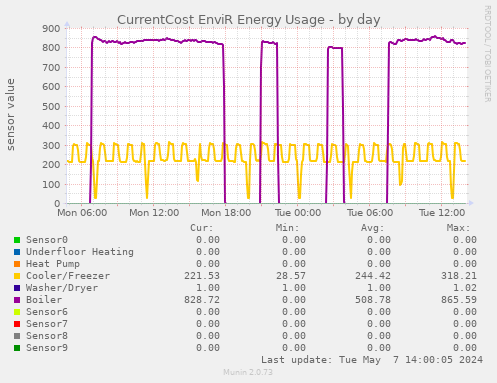
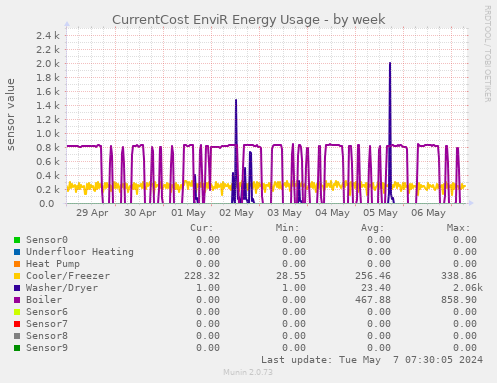
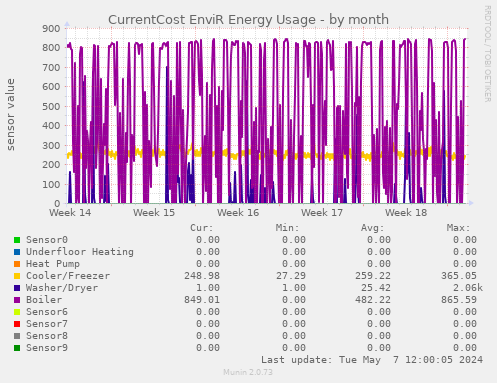
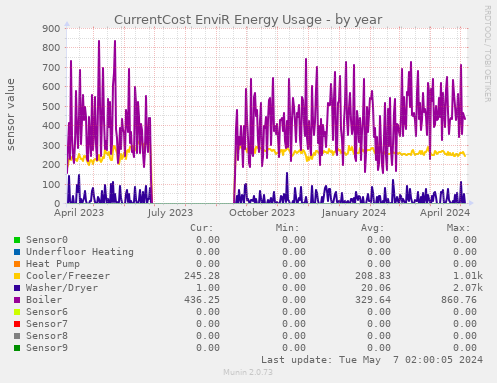
This graph shows the values of sensors connected to a CurrentCost EnviR device.
| Field | Internal name | Type | Warn | Crit | Info |
|---|---|---|---|---|---|
| Sensor0 | sensor0 | gauge | Watts. | ||
| Underfloor Heating | sensor1 | gauge | Watts. | ||
| Heat Pump | sensor2 | gauge | Watts. | ||
| Cooler/Freezer | sensor3 | gauge | Watts. | ||
| Washer/Dryer | sensor4 | gauge | Watts. | ||
| Boiler | sensor5 | gauge | Watts. | ||
| Sensor6 | sensor6 | gauge | Watts. | ||
| Sensor7 | sensor7 | gauge | Watts. | ||
| Sensor8 | sensor8 | gauge | Watts. | ||
| Sensor9 | sensor9 | gauge | Watts. |